Back to Case Studies
Data & BI Engineering

Tracking & Analytics Systems

Converting raw operational data into actionable business intelligence. From trading performance tracking to multi-vendor sales dashboards.

Performance Metrics

Visualizing KPIs, R-multiples, and growth trends over time.

Data Structuring

Designing schemas for pivot tables and complex queries.

Real-time Logging

Event-driven data capture for immediate insight.

If you can't measure it, you can't improve it.

Every system here was built to turn raw noise into structured, queryable intelligence.

01

Christmas Market Web App

Multi-Vendor Live Sales Tracking

A multi-vendor sales tracking system built for a live event.

Real-time revenue tracking, artist tagging, and automated reporting.

The System

Built for a live Christmas market event. Multiple vendors log sales in real-time. The system tracks revenue per artist, calculates payout splits, and generates automated reports for event organisers.

Multi-user Access Control
Real-time Revenue Dashboard
Vendor-specific Payouts
Automated Event Reports
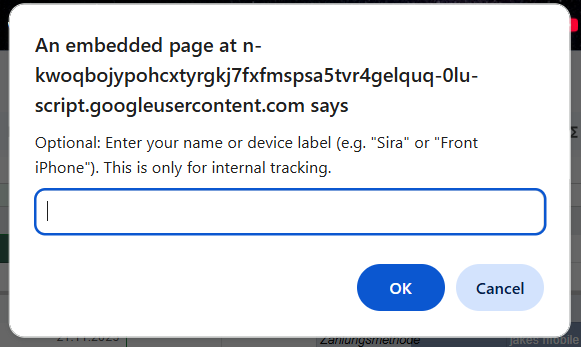
Device tracking prompt interface for multi-vendor sales logging
Device tracking — Sales entry prompt
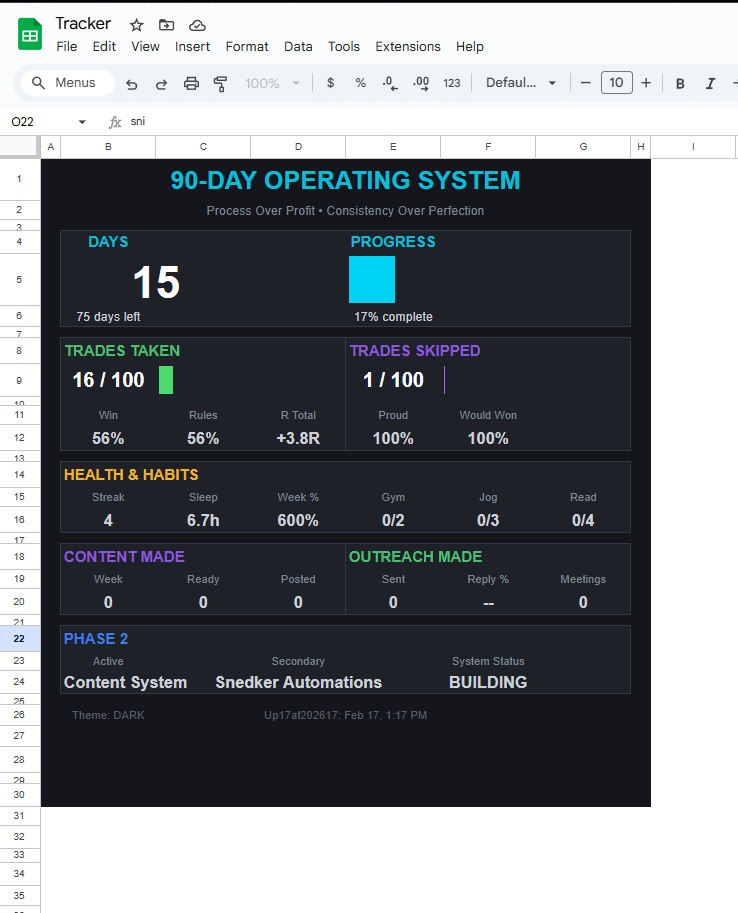
90-day operating system dashboard showing vendor performance and payout tracking
90-day operating system — Performance dashboard
02

Trading Performance Tracker

Behavioural Tagging & Equity Analysis

A deep dive into trading behaviour — not just P&L.

Tracking psychological tags, R-multiples, and setup win-rates.

What It Tracks

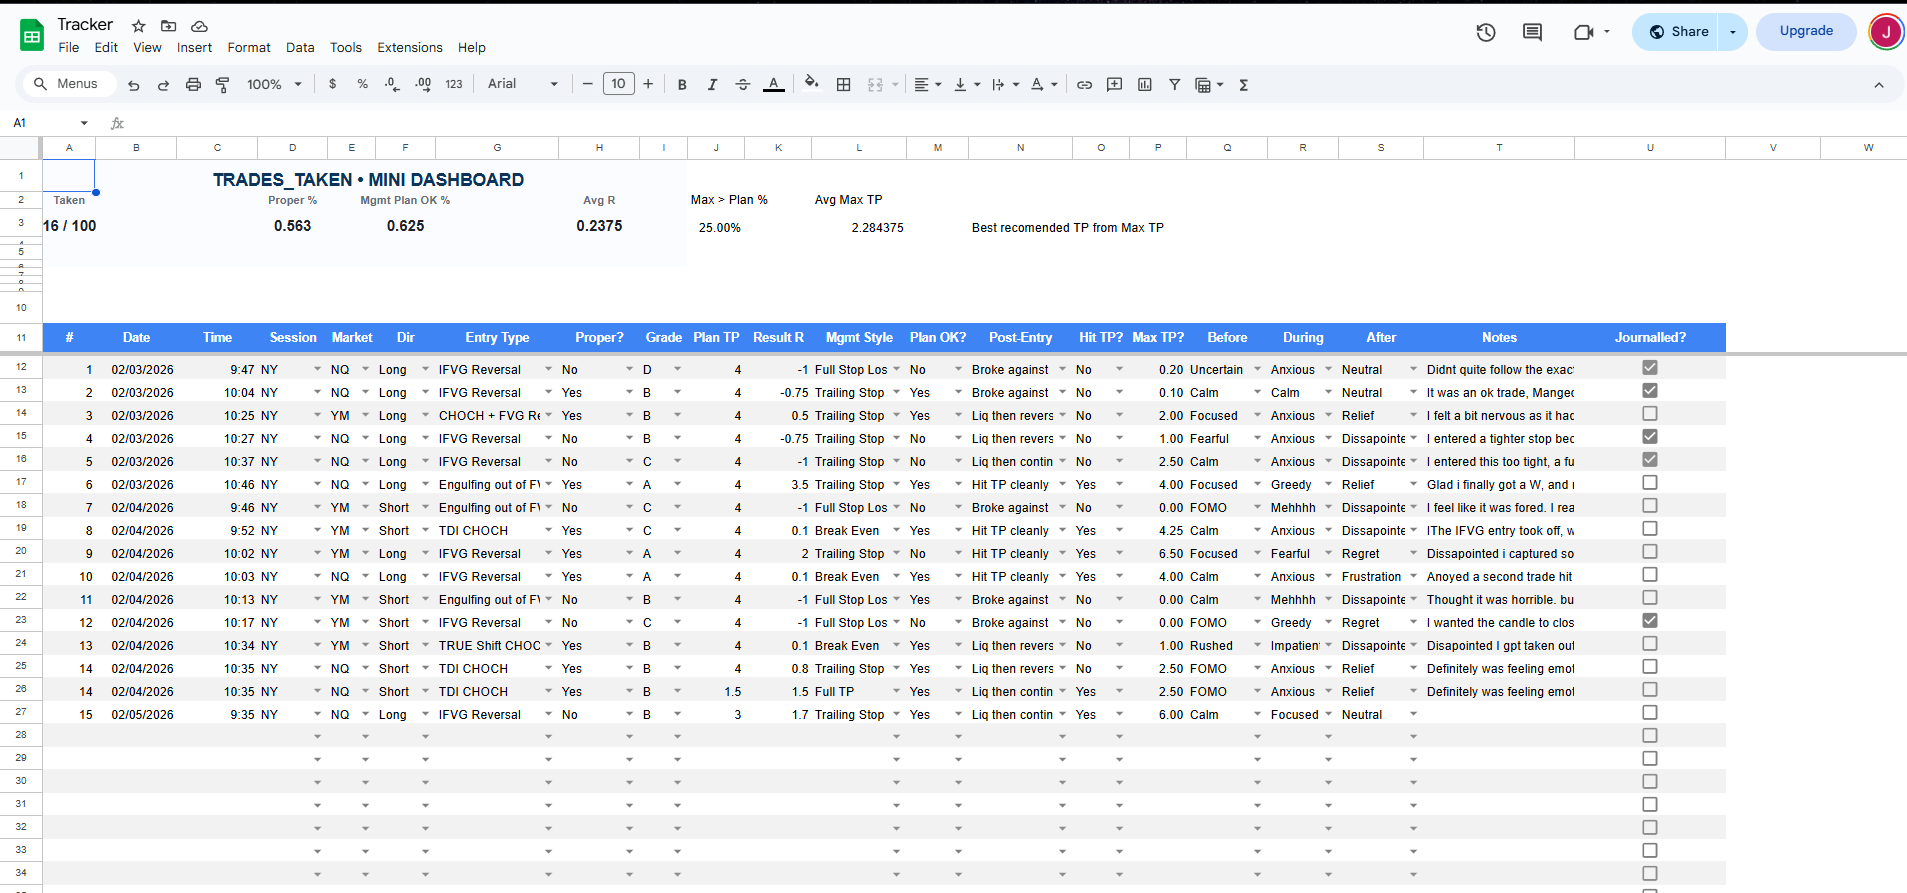
Goes beyond simple profit/loss tracking. Every trade is tagged with behavioural metadata: setup type, emotional state, adherence to rules, and R-multiple outcome. This data feeds into pivot table analytics for strategy refinement.

Behavioral TaggingR-Multiple TrackingSetup Win-RatesEquity Curve SimulationsPivot Table Analytics

Equity Curve Analysis

The tracker simulates equity curves based on different risk parameters, allowing comparison of how the same trades would perform under varying position sizing and compounding rules.

Pattern recognition over individual trade outcomes.
Trades taken mini dashboard with R-multiple tracking and session analysis
Trades taken — R-multiple tracking
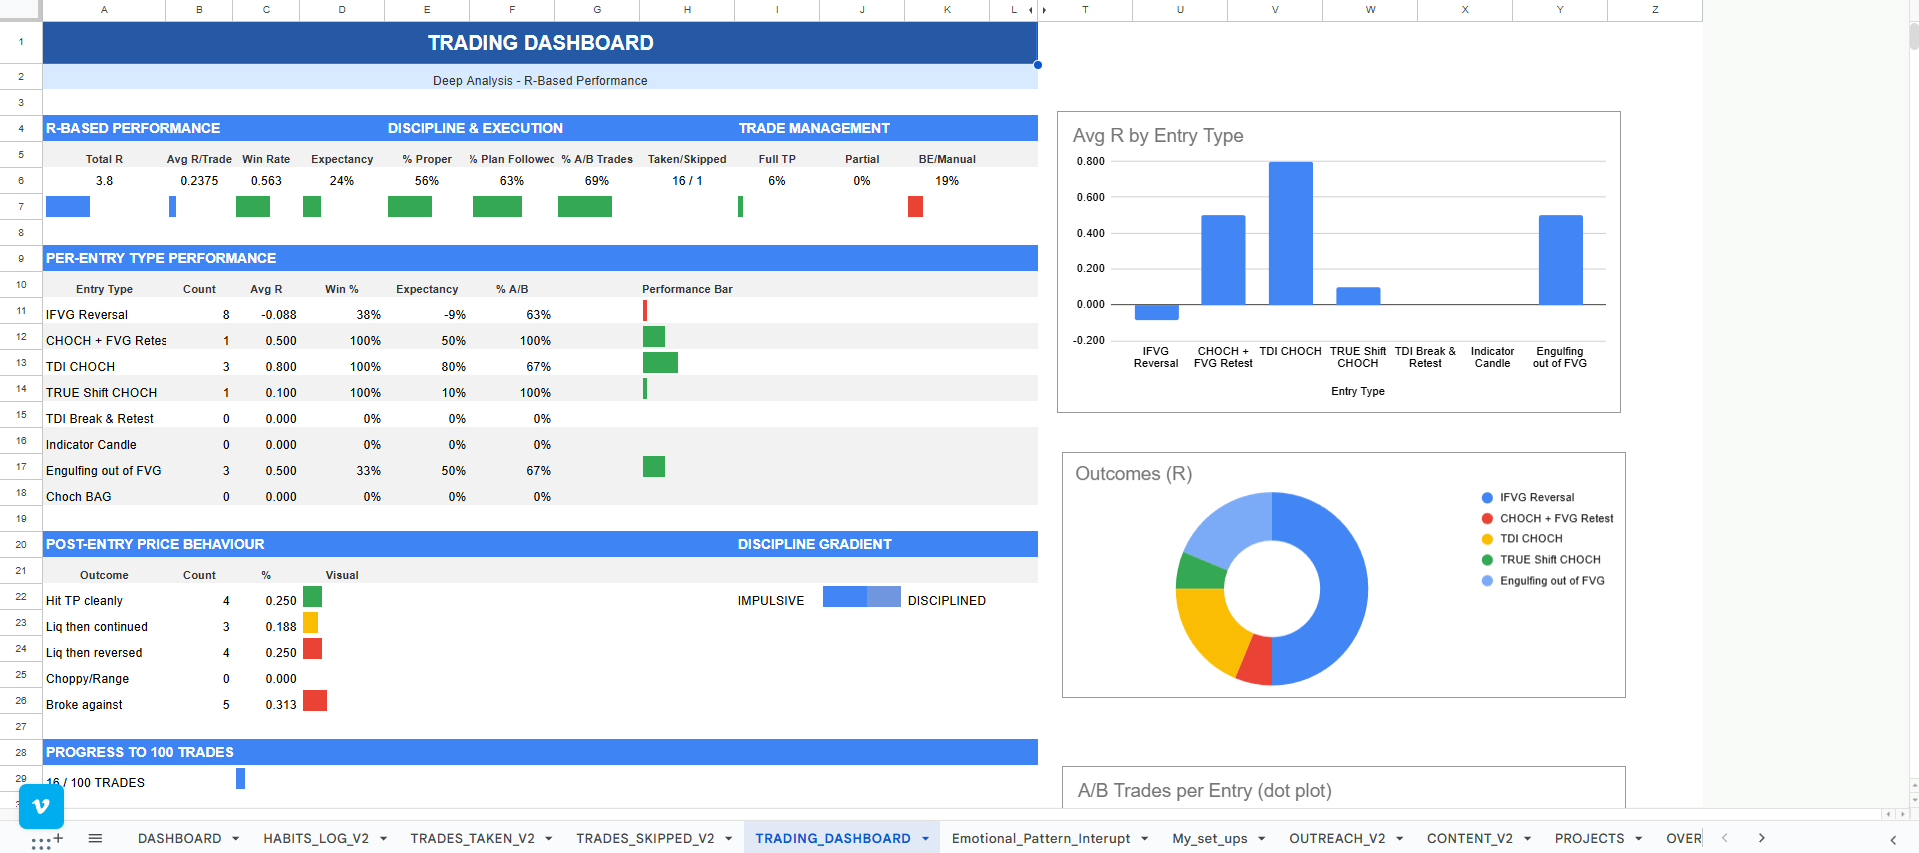
Trading dashboard with equity curves, drawdown analysis, and performance charts
Trading dashboard — Equity & drawdown analysis
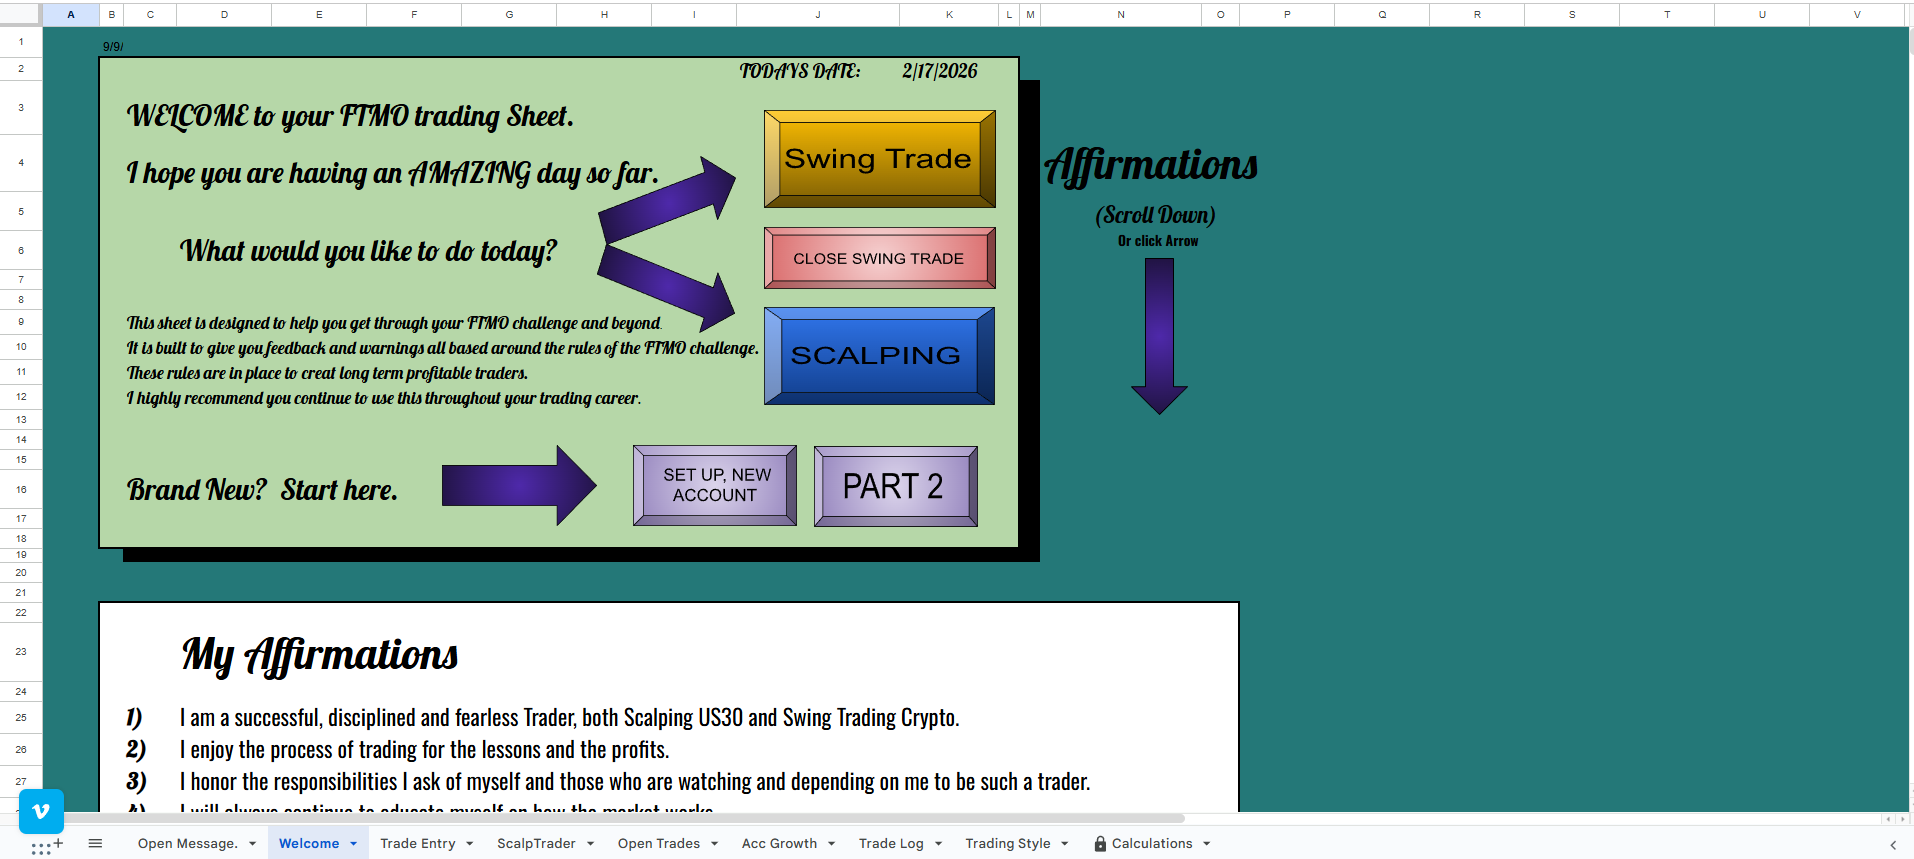
FTMO trading sheet with structured data entry and performance tracking
FTMO trading sheet — Structured data entry
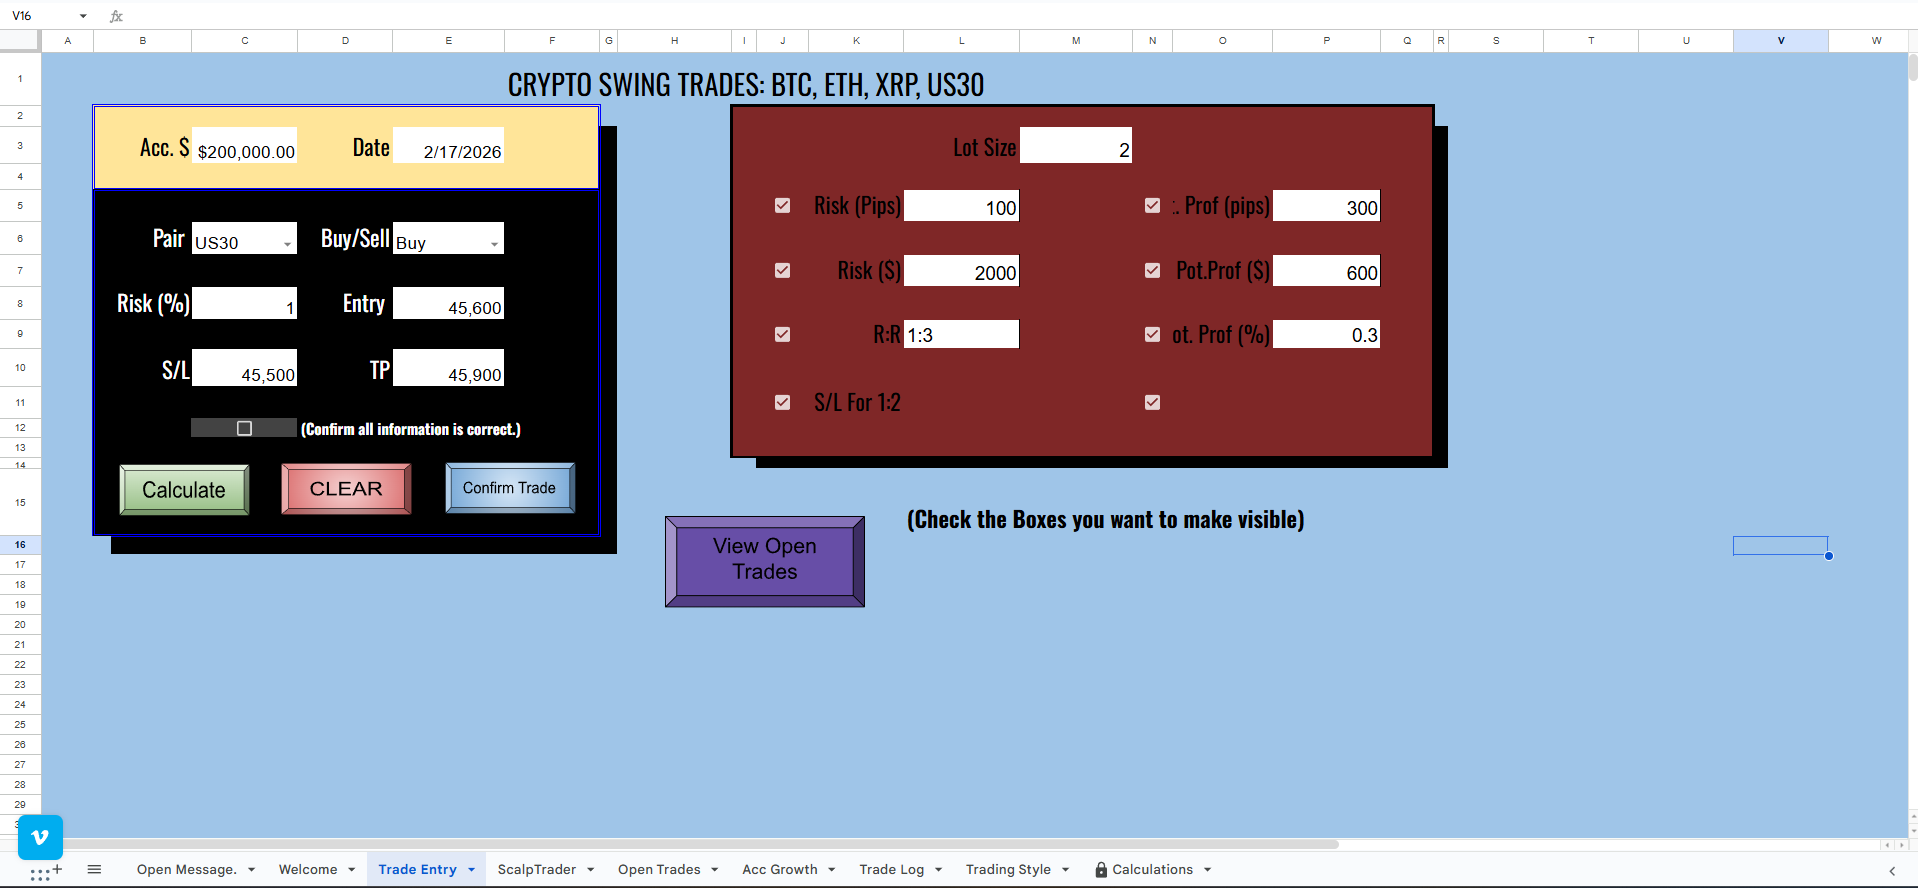
Trade entry calculator with position sizing and risk parameter inputs
Trade entry calculator — Position sizing tool
03

Data Philosophy

How Tracking Systems Are Designed

Schema-First Design

Every tracking system starts with schema design. Data structure determines what questions you can ask later. Getting the schema right means analytics are effortless — getting it wrong means rebuilding from scratch.

Query-Ready by Default

Data is structured so that pivot tables, aggregations, and time-series queries work out of the box. No post-processing, no data cleaning pipelines.

Normalised schemasTime-series indexingPivot-ready structureEvent-driven capture

Summary

These aren't spreadsheets with charts.
They're purpose-built data systems designed for the questions that actually matter.

✓Schema-first design
✓Real-time capture
✓Pivot-ready analytics
✓Behavioural tagging

Structure the data.

Ask the right questions.

Let the answers surface themselves.

Snedker Automations Assistant